Breakpoints
Breakpoints stop the execution of automation logic at the selected points, letting you examine the information about the current running state. Breakpoint data and functions are accessed from Breakpoints window.
To set a breakpoint, click an execution link to select it. Next, right-click the link and select the Toggle Breakpoint option. Once set, the breakpoint is displayed as red dot over the link. To disable or delete a breakpoint, right-click the breakpoint and select Disable or Delete.
Debugging with breakpoints
Start the project in Debug mode to use the breakpoints. When a break point is reached, the execution of the project stops. You can resume execution using these function keys:
Press |
To |
F5 |
Continue the execution until the next breakpoint is reached. |
F10 |
Move execution to the next event link |
F11 |
Move execution to the next event link. Pressing F11 again remains in the current thread and stops on the data link. |
Note: You can add a break point at any time while debugging.
Breakpoints window
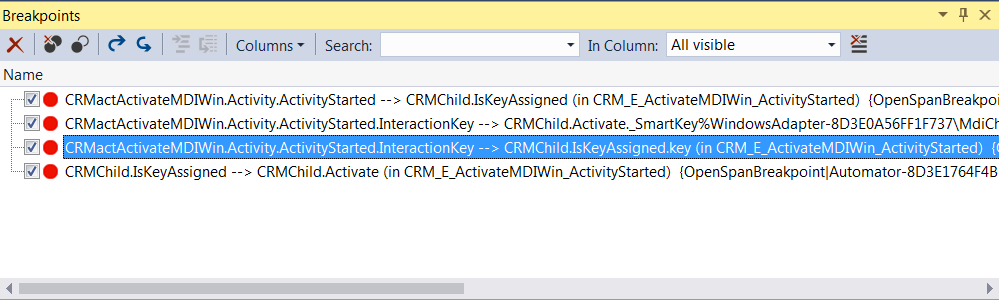
The Breakpoints window shows all the breakpoints in the project. The breakpoints have check boxes next to them. When the breakpoint is enabled, the box is checked. In addition to listing the breakpoints, the window provides functions for deleting break points and selecting the type of data (columns) to display. Here is an example of the Breakpoints window:
Breakpoints window functions
![]() – Delete
current breakpoint.
– Delete
current breakpoint.
 – Delete
all breakpoints.
– Delete
all breakpoints.
 – Disables/Enables
all breakpoints.
– Disables/Enables
all breakpoints.
![]() –
Not applicable in Studio automations.
–
Not applicable in Studio automations.
 – Not
applicable in Studio automations.
– Not
applicable in Studio automations.
 – List the types of data that
can be listed for the breakpoints. The options are:
– List the types of data that
can be listed for the breakpoints. The options are:
Name
Condition
Hit Count
Filter
When Hit
Language
Function
File
Address
Data
Process
See the MSDN Breakpoints and Tracepoints topic about the information displayed in these columns.
